

Review of HDFC Mid Cap Opportunities Fund
Review of HDFC Mid Cap Opportunities Fund
Large Assets Hurting the Fund?

Let us review the HDFC Mid Cap Opportunities Fund (HMCOF) today. This blog may devolve into a long commentary on why not to invest into active mutual funds. Beware! Also, I have quite a few links to various articles. I would definitely urge you to explore some of them and we gain better understanding.
HMCOF is one of the older funds (launched in 2007) in India and has actually been having the same mandate (Mid cap stocks) from the beginning. Interestingly it has had the same fund manager (Chirag Setalvad) from inception.
Straight off, let us look at the fund performance since inception and compare against its natural benchmark (Nifty Midcap150 TRI). Over the entire lifetime, the effective out-performance of the fund is ~5.1% per annum. That is indeed impressive.

Let us now look rolling annual returns.
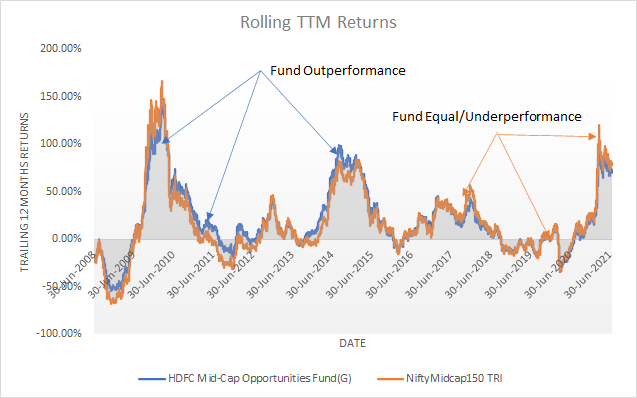
The fund clearly had a great period of out-performance until 2016 but since 2016, periods of out-performance against the index have reduced. Let us plot the fund’s out-performance against the index on a trailing 12-month basis.
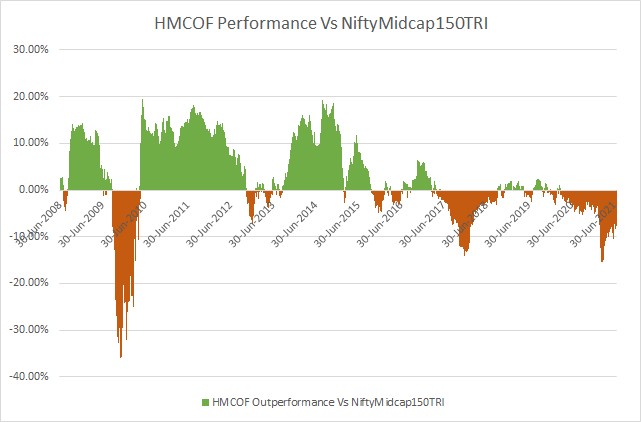
For about a year from Mid 2009 through Mid-2010, the fund massively under-performed the index. But after that, the fund has been mostly doing well until 2016. From 2016, the duration and magnitude of under-performance has increased whereas the duration and magnitude of out-performance has reduced. Another way to visualize the situation is via SIP returns. SIP returns are a good way to capture consistency of a fund. Below table as of Jun 2021.
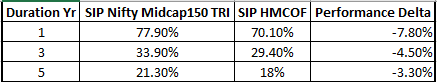
Investors are losing 3.3% per annum over the last 5 years against the index! Considering that this is a Mid-cap fund, the fund manager is same, I would argue that the fund is overburdened with assets and is out of capacity for the fund manager’s style of stock selection.
Fund Capacity and Limitation
I got introduced to the concept of fund capacity by this great blog (by Ajit Dayal of Quantum AMC). I would definitely urge you read it. Basic notion of fund capacity is that every fund manager’s style of investing has a limit. The limits to this capacity come with assets size due to capitalization and liquidity of stocks. Say you have a portfolio of 1cr with 25 stocks. Each stock has rough weight of say 4lac rupees. Now if you go to the broker and execute, it is highly likely that most company’s shares can be purchased given that we only need to buy 4 lac rupees worth each. Also, when you place a buy or sell order, there is a cost called “slippage cost”. Now, when the money to manage becomes say 1000 Cr., the same 25 stock portfolio would each need to be around 40cr each. There are not many company’s shares that trade daily with 40cr. What this means is you may have previously picked a multi cap style of portfolio but now are forced to move up the capitalization and pick say large-cap names. Also, the slippage costs increase as you try to buy or sell a portfolio worth 40cr in each name. I would urge you to read the following blog (Alpha or Assets by OSAM team) as well.
HMCOF Capacity
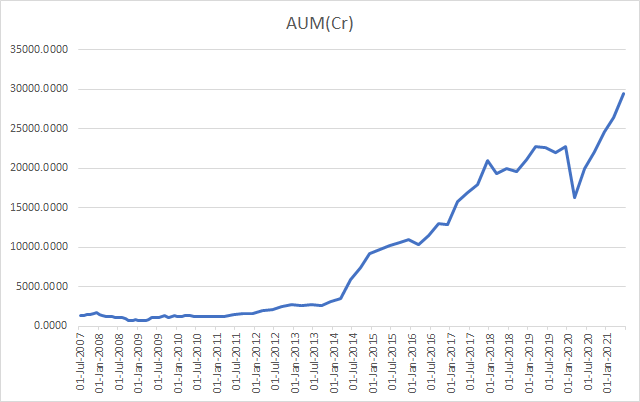
Below graph shows the AUM growth over time in the fund.
Let us try to look at the latest portfolio disclosure of the fund here and here. The below table shows for the holdings, the number of days of continuous trade to exit the stock based on last 12 months trading volumes on these stocks.
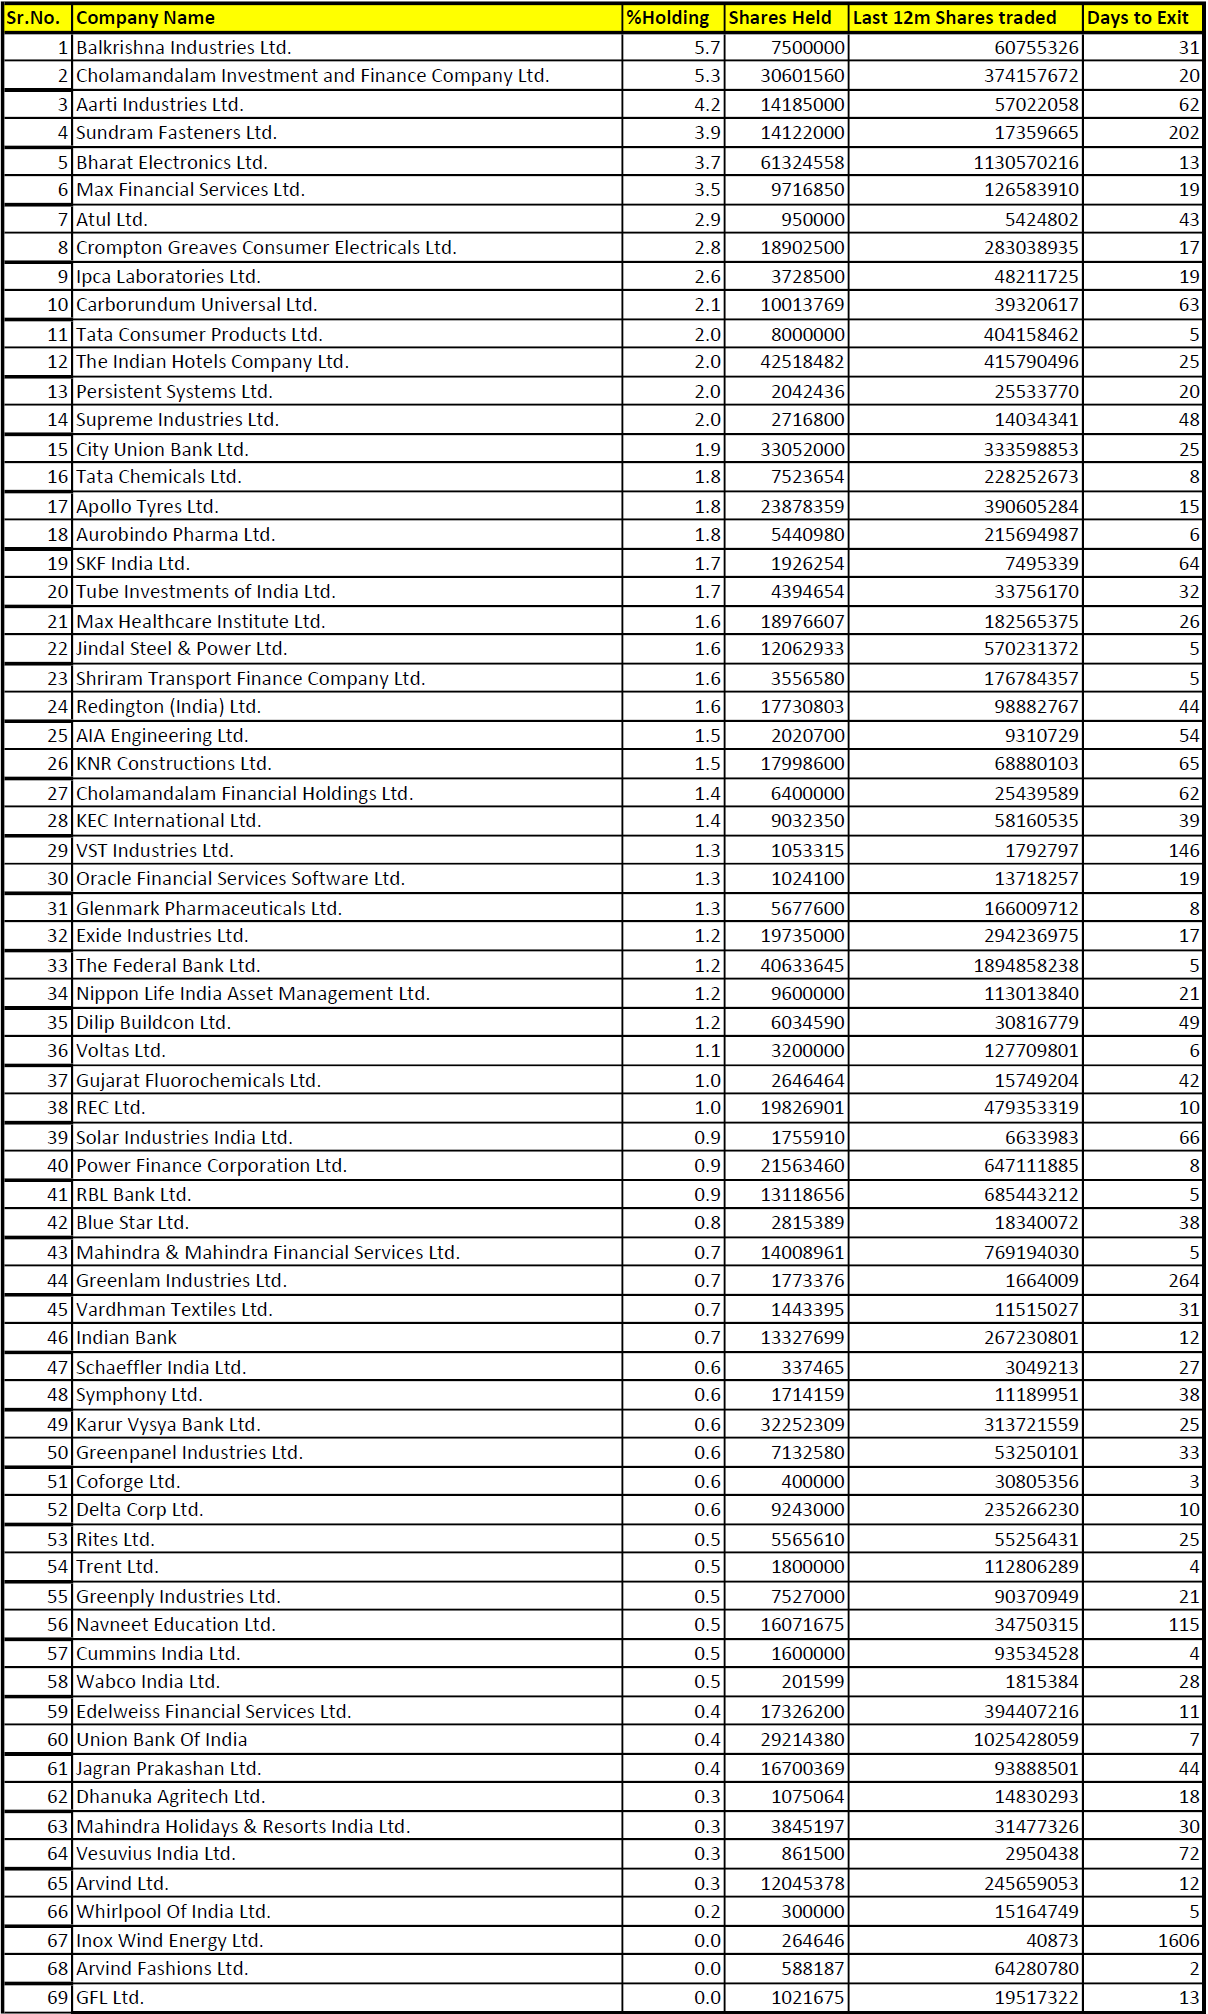
Imagine selling Balkrishna Industries continuously for 31 days and you are the biggest seller. That will exert an enormous amount of pressure on the stock during that selling. Or what if the fund manager has to sell Sundaram Fastener? It would take him/her ~10 months to exit the position. This is true when buying as well. By the time a reasonable position is taken, the fund will need to keep buying on a daily basis and hence will increase the cost of trade. Very likely you will have to resort to bulk sales which may not be to your liking.
To better appreciate how big this problem can be, refer this data from NSE website. The market impact cost of a typical 50lac Rupee Nifty50 stock is ~0.02%. Whereas for the next 50 stocks (NiftyNext50), the market impact cost for ~25lac rupee holding is 0.1%. That is an increase of 5x as you went from first 50 stocks to next 50 stocks despite trading only for half the value. As you go to mid-cap stocks (the next 150 stocks), even if you assume an impact cost of remains the same as the NiftyNext50 stocks (it must be worse), for the largest holding (1678Cr), you can imagine the cost of market impact! If there were a sell off like Covid-2020 or say the 2010 draw down, the selling pressure on the fund can be huge.
Options for Fund Manager
Every Mid and Small Cap Fund manager must know the limitation of their chosen strategy. Ideally they must disclose it. In absence of it, as in this case, I think fund has the following choices:
Convert the fund to a closed ended fund and control the entry and exit of new corpus.
Stop accepting any funds. Many small cap funds have done this in the past (albeit at lower AUM). A Midcap fund can have higher AUM but must stop accepting new funds “at some point”.
Summary
Clearly, the fund manager has pedigree and have exhibited the same. But, over time, the fund’s out-performance has dramatically worsened. The SIP return lag tells us that fund has been under-performing consistently for a while. I do believe that fund assets have grown (esp. from 2014) in a huge way and have contributed to this situation. The fund manager is unable to perform against a very simple index and the magnitude of under-performance is worsening.
There are better and cheaper Mid-cap Index funds that I would advise to select over this fund. One can hope and wait for out-performance in future. I would NOT take that bet. Caveat-Emptor.