
How to Select a Mutual Fund?
Most Equity Mutual Funds SUCK!

Today’s blog has been long time coming. I have been reviewing various mutual funds and the ratio of invest/not invest has skewed towards not invest. I have received many comments on Twitter and elsewhere suggesting looking at funds with positive reviews. There were some comments along: “who has the time to do comparison with funds, the various mutual fund metrics to decide how to invest etc? Is there a simple way to judge a mutual fund?” I decided to do them both. We shall look at a simple metric to judge a fund’s selection. We will compare as many diversified mutual funds as we can based on this simple metric.
How to Analyze a Mutual Fund?
At the outset, I want to clarify that equity mutual funds are the best investment vehicles for the majority population. This mechanism of pooled investment vehicle at low cost is probably the best way to build wealth.
Which mutual fund should you invest in? How do you analyze a fund? What are the meanings of various terms alpha, beta, Sharpe ratio, Sortino ratio, volatility, information ratio etc.? I do not think it is easy for most people to understand all the terms above. I argue it is not necessary to know either.
Consider an example of HDFC Top 100.
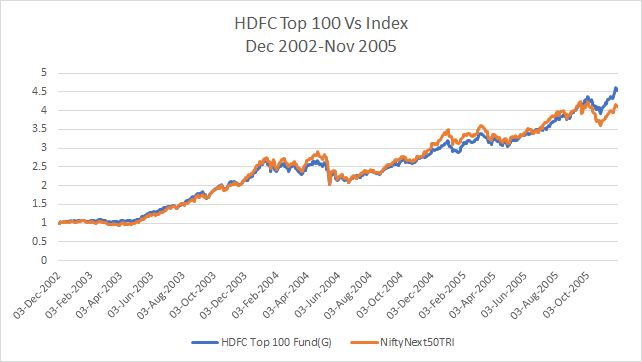
From Dec 2002 through Nov 2005, the fund was simply tracking the index. But then came the outperformance.

In fact, leading into the financial crisis, it fell less and “feels like” recovered more. Below is what happened from Jan 2009 through now.
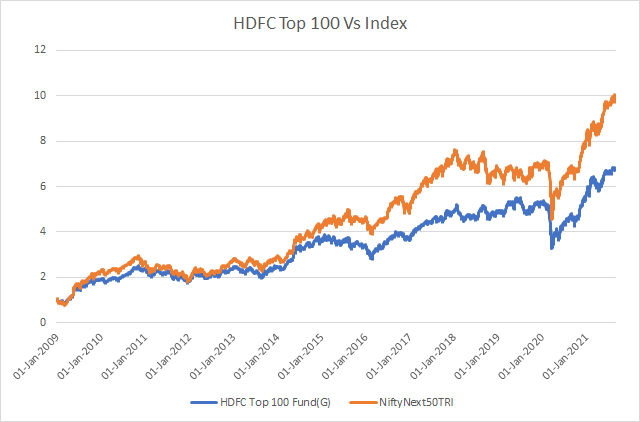
The fund has in fact been a horrible underperformer and always worse than the index. Numbers can be deceptive about the future. In fact, the worst affected investors were those who joined the fund in early 2011 when the fund seemingly was at its best out-performance relative to the index.
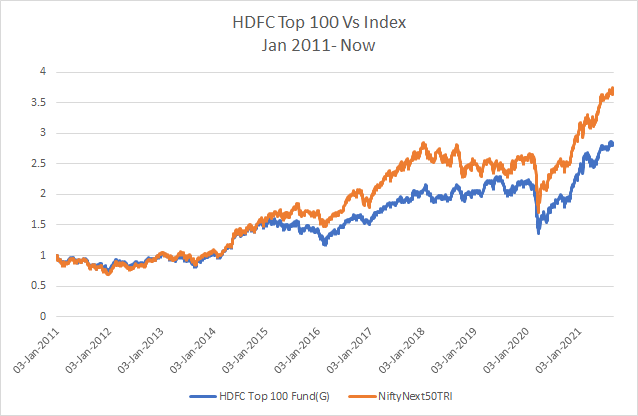
Finally, the graph below shows it for entire period. The fund can continue to claim they beat the index (ever so slightly) over last 18+ years but reality is all most investors did not make money.

The above set of data clearly shows a few things:
Performance evaluation must be done over longer periods of time.
Funds can do better/worse/similar than index at various times. We are interested in duration of out-performance vs under-performance of down time.
We are also interested in magnitude of out-performance/under-performance from time to time.
I suggest that we introduce a very simple alternative: SIP returns.
Most of us understand: SIP : Systematic Investment Plan. We essentially invest ever so frequently (mostly monthly) and see the money grow. Assume you invest money at every time of the fund’s existence. Now, check and compare the long term returns against an index. It should capture all of this in an easy way. If the fund consistently outperforms despite similar average return as index, SIP returns will be higher. If a fund beats the index by a one-time huge magnitude but many times it lags the index, the SIP returns will be lower.
To complete the example above, below shows the growth of Re 1 SIP over time in the same fund.

On a side note, we reviewed the HDFC Top 100 fund. Avoid it!
To be honest, this is not a new idea. The finance industry is aware of this already. They call it “Time Weighted Returns” (TWR). There are many websites that today provide you the SIP returns directly. Compare against an index and you probably have an answer.
Batch Mutual Fund Review
Let us use this simple tool to do a review of many different schemes. We shall set the universe as all regular, open ended, growth options of all diversified equity mutual funds in India as of today. We shall add contra funds and value funds to the list. We avoid all international funds, index funds as well as any sector funds. We will review all those funds who have at least 7 years existence data. We shall compare against SIP returns into two popular indices: Nifty500TRI and NiftyNext50TRI. For why these, please understand that most broad market indices are correlated. You can read them here. Indices data is taken from niftyindices website. NAV data obtained from AMFI website. We shall start from Dec 2002 as we have data for the NiftyNext50TRI only from then.
We start with all funds that have existed before 2002. Below is the performance of these funds and their SIP. I have put a Rank and percentile number to them. This has 36 funds in it.

As can be seen, 68 % funds cannot beat the NiftyNext50TRI. So, there are 34% funds which cannot beat the Nifty500TRI index after 19 years. What about the class of 2003? We shall call all funds with NAV data prior to Dec 2002 but having any data from Jan 1, 2004, as Class of 2003.

The class of 2003 is worse. After 17+ years, the mid cap index is the best performer while the 50% funds cannot beat the large cap index.1
It looks like less than a quartile of them beat the NiftyNext50 and less than half beat the Nifty500. Let us see if there is a broad trend emerging. I merge mutual funds to get a cohort of 35-40 funds and take SIP returns on them.
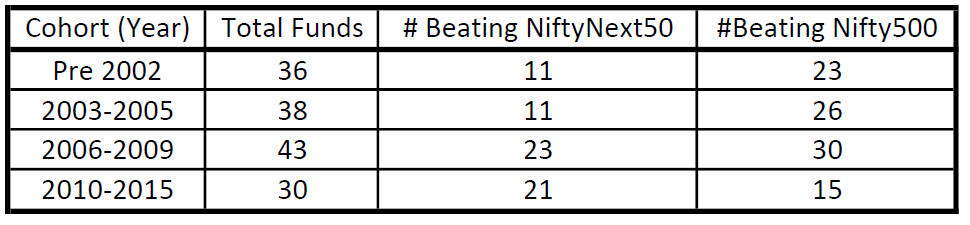
At least 50% funds do not beat one of two indices. That is a staggering number. You are picking a fund manager(s) for their skills to identify the best performing index, but the reality is that most fund managers are unable to really beat a very simple free float market cap weighted index or its mid-cap counterpart. What is also important to see is by how much is this out-performance after so many years? I modify the above table to capture quantum of out-performance. The idea for the chart below is from the book “Bogle on Mutual Funds”. 2
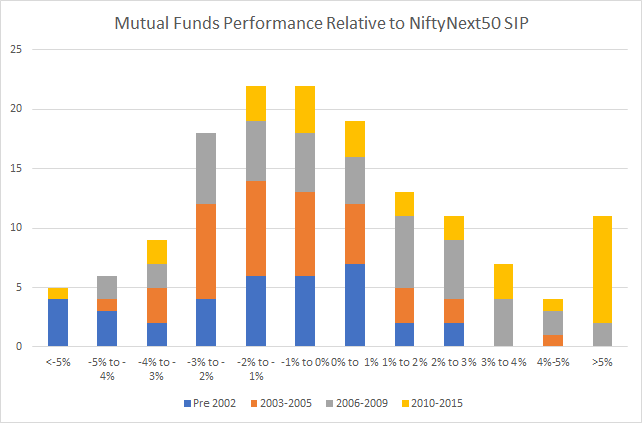
Even amongst the funds that do beat the NiftyNext50, less than a quarter do so with greater than 1% excess returns consistently. I share the same graph above in another way.
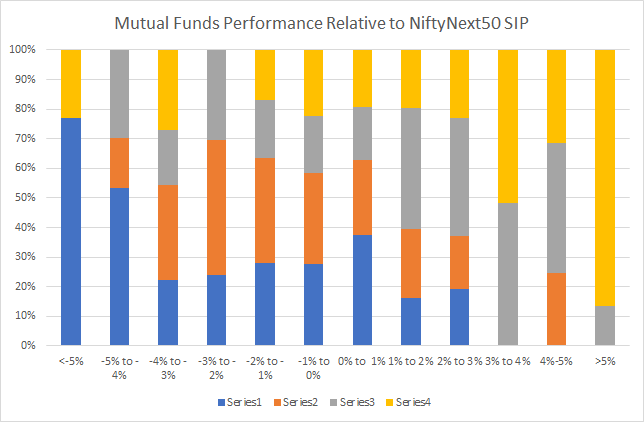
The cohort of 2010-2015 (recent funds) have been performing better than the prior cohort. Not only higher percentage of funds are outperforming, but also the quantum of out-performance is higher. But, if you keep sliding towards older age funds, you will notice that the number of funds outperforming is reducing and those that do outperform do it with reduced quantum. This behavior is also called “regression to mean”. That is most funds/fund managers are not better than average. They are likely average. It also tells us that assessing a fund based on duration of 6 years is faulty. The true colors of most mutual fund schemes get revealed only when you have longer term data. Prudent decision would be to review with at least 10 years data.
It is important that highlight a small mistake in above data. The above data is without considering cost of running an index mutual fund. Index mutual funds are not “free” products but are “almost” free. There are funds available for less than 0.05% expense ratio. In a world where beating the index by 0.5% or 1% is tough, it also tells you the importance of direct vs regular schemes. In a regular scheme, a mutual fund distributor is paid 0.5-1.5% in additional expense ratio. If you can, select a direct index scheme. At the minimum, look for a fee only distributor and invest directly to see your money grow over time.
But the unavoidable and possibly difficult conclusion must be most mutual fund managers cannot beat the market net of all costs their customers (Us: You and I) pay to them.
Unless you know better, the default advise would be to simply invest into a low-cost equity mutual fund.
Sobering Thought
Less than 40% fund beat one of indices. This is also a reason why one must choose to avoid investing into all NFO unless a lot of information about future portfolio formation is disclosed. It would be great if fund managers share the expected out-performance. Quite clearly there is a lot of misselling happening in the industry. If your advisor is suggesting an investment into a NFO, the chances are high they are not suggesting with your interests in mind.
This data should also provide a mirror to a lot of us who keep hoping to do better than the market. If professionals with the best tools/data/information are unable to beat the market, what are the odds that we, individual and unsophisticated investors have in beating the market? Why should we even be attempting this process of reading so many books/magazines/subscriptions all to “beat” the market. Unless you are really the kind of person who can dedicate enormous amounts of time to learn about the markets, my personal suggestion would be invest into low-cost mutual funds and explore opportunities that give you pleasure (any hobby/ holiday/spend time with friends & family etc.).
Of late, I see lots of financial gurus talking of identifying future stocks, coming up with different methods to “beat” the market. My twitter timeline is filled with instances of people providing stock tips, of training material on how to identify the future winners etc. TV channels are filled with advice on stock selections. It should be clear that most of these “advisors” are providing bad advice. Most AIF, PMS are no different. In fact, in many cases, the same professionals may be behind a mutual fund scheme and an AIF/PMS. Armed with the data we have; we can surely say trying to beat the market is a fool’s errand. One can only assume that a large portion (not entirety) of the personal finance industry is against the investor’s best interests.
This should also explain as to why so many of the funds reviewed thus far have been with an avoid recommendation on this blog.
Not all is lost
If you have been patient and reached here, a sense of gloom and doom in equity mutual fund selection is probably inevitable. Is there is no hope at all for us as consumers to grow our wealth through the mutual fund route? I would argue there is.
I do believe that active investing can beat the markets. It is undeniable that there is a non-negligible count of funds which do beat the index by a handsome margin. We do not need to have many of them, but a few good ones are probably what we care about.
Hereon, this blog shall review only those funds which are NOT in the avoid category. I shall maintain a page of all funds that can be considered for investing. You can keep referring to the page from time to time. From time to time, we shall also explore strategies individual investors can explore. We shall also explore other investing ideas I am learning of.
Conclusion
We proposed a simple and easy technique for measuring a mutual fund’s performance: SIP returns. SIP returns are a version of Time Weighted Returns. For an open-ended fund, this is a good way to measure fund performance. When selecting a fund for review, look for at least 10 years of history. Do not invest in NFO.
Most mutual funds do not beat the market net of costs. The default advise to most investors should be to invest into low-cost index mutual funds. Avoid financial media.
Happy investing to all of us.
For what it is worth, I opine that the Indian market is filled with mostly mid cap companies. So most mutual funds must be bench-marked against the Niftynext50TRI. Read this link to understand why I feel so.
I do suggest reading “Bogle on Mutual Funds”. Book was written back in 1993 for USA audience but it is amazing how almost all of material is relevant in India after so many years.
@Sharat I agree with post your points especially the point where can active fund beat an index fund over 2 3 decades consistently no one knows.
But I disagree using Nifty Next 50 as any benchmark. It’s an index which is discovered cutting broad market index and mining past data suddenly having higher returns people think they have found gold. Last 5 years it has not even beaten N50 TRI if you run sip or one time investment.
I think we should still stick to N50/N100/N500 any other index or ratio (50:50 for example N50:NN50) you are trying outsmart the market thus going away from the simplicity and index principle.
It’s like saying S&P lower 250 can have higher returns than top 250. So rather than using market weighted S&P 500 using 2 halves of 250 in ratio 50:50 to get higher returns :) S&P500 or VTSAX are equivalent index in US.
Simple N50 or N100 (whether as a single fund or synthetically created 85:15 ratio N50:NN50) should do the job in India (N500 still has liquidity issues). Anything else you are again doing the same thing which you wanted to avoid when you moved to index investing.
Sharat, You wrote: "Less than 40% fund beat one of indices. This is also a reason why one must choose to avoid investing into all NFO unless a lot of information about future portfolio formation is disclosed." If anyway less than 40% funds beat indices, and portfolio formation anyway will change and will be "passively managed" in the real sense, in most cases, why should NFOs be avoided? I ask this in all sincerity, as someone trying to understand all of this as a new investor. I understand it is not clear for NFOs how and where the money will be invested, but if current MFs perform dismally vis-a-vis indices, then anyway a simple investor has no other option other than take his chances.
If possible, please elaborate and suggest a way out for those examining NFOs rather than current funds where they already put a disclaimer "Past performance is no guarantee of future performance, or whatever"