


Moving Averages and Volatility
Follow the markets not your predictions

I come back to blogging after a hiatus of around 2 months. It has been 2 months of festivals/celebrations and office work which has kept me busy. A reminder to all readers that I have a day job and that I am not a finance professional. So, consume the blogs cautiously and at your own risk.
In the last blog, we guessed the future. Before we proceed any further, reasons to be sceptical of any guesses/predictions:
I am a newbie to the world of finance, and I do not know what I am writing/talking about. Always be careful. It may be all Jabberwocky
I am guessing about things 10 years from now. The authority on forecasting is Philip Tetlock. One of his sayings has remained with me (paraphrased) “Any forecast for longer than 5 years can be safely ignored”. So, there you have it, another evidence of jabberwocky from me.
The model is incomplete and may need further tweaking. I already tweaked it over the last few months, we do not know what more tweaking I will do. Also, the model fit is not 100%. What if the future ends up in the other 24% time when the data did not fit?
Finally, and most importantly, assuming everything I guessed is correct and it does materialize as mentioned, it does not /cannot predict the path of the equity curve.
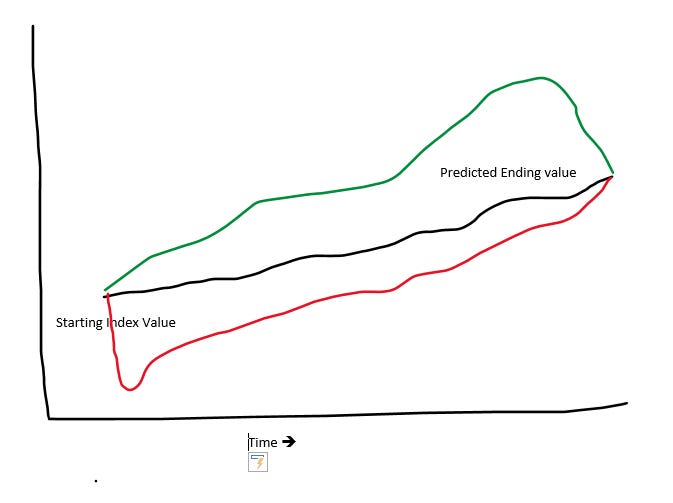
Hoping and more seriously betting on the red path is lunacy. We would be wrong if the green path is how the future plays out. I have not predicted the path end-point estimate of the future. These are just three of the paths I have shown. Any number of different paths could be foreseen in the future.
The best example to provide is what happened in late 1999. By late 1998, there were already calls saying USA markets were overheated and were expensive. By Dec’98, the USA CAPE ratio was at an all-time high of ~40. The markets kept going up even more. In fact, from Oct 1999 to Mar 2000, the Nasdaq100 index went up another 110% before topping off before the eventual correction set in. If you had bet money for a downfall of markets in Oct1999, in a mark to market world you would have lost shirts. I am reminded of legendary investor George Soros’s 1998 interview (watch it here esp. from 16:00) when asked whether to sell short or quit the market given his forecast of recession, he says “I wouldn't like that; the final cycles of a bull market, the biggest profits are made”. He was so correct. The best part to learn was his approach to the markets is to react as the markets evolve rather than acting on our or every individual’s forecasts.
Moving Averages
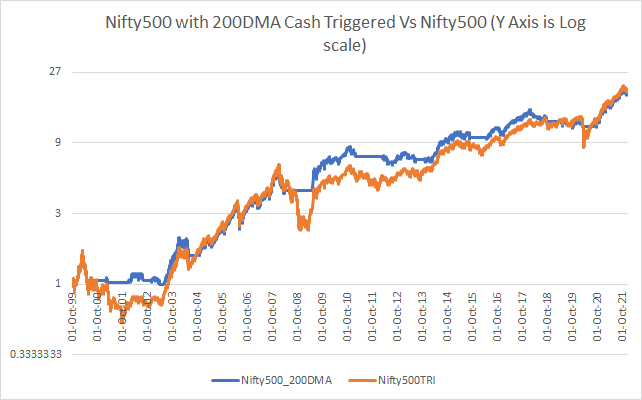
Moving averages have been tools investors have been using to track market regimes for a long time. One of the most used moving averages is the 200d moving average. It is the simple arithmetic average of the closing price of the previous two hundred trading days of the underlying security. There are different moving average trading rules and without delving deep into them, we will take the most popular one. At the beginning of every month, if the asset closing price the day before was above its 200DMA, continue to invest else, move to cash. Let us try this simple rule on the Nifty500.
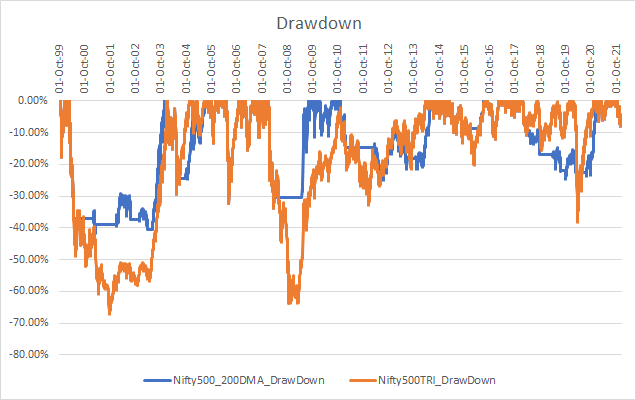
This is how the drawdowns look.
Below are summary statistics.
It is remarkable how after 22+ years, despite being invested for only ~69%, the investment strategy has worked remarkably well. I have assumed taxes are zero and one must keep that in mind. Observations
The strategy rode the 2000 tech bubble top.
Avoided the 2000 crash and stayed in cash for almost 3 years while the market was in its turmoil.
Avoided 2008, 2011, 2013, 2018, and 2020 crashes
We can choose to invest in a bond fund or even liquid funds to increase returns during the period when not invested in risk assets.
The blue line despite being “up” in mid-2002, the orange line “catches up” indicating that the 200DMA strategy is under-performing. It also is a pointer that the revival in performance can be extremely fast for the orange line.
The last line in (5) above is important that revival can be extremely fast as can the fall be extremely fast too. So let us look at daily returns when the regime filter is on and when not. Below is summary of daily returns of when the index trades below its 200DMA
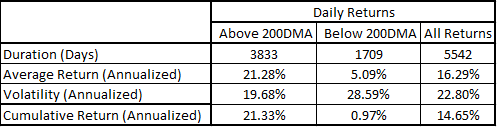
The period below the 200DMA has been of lower returns. But the above numbers are deceptive. Looking deeper, there is not enough statistical evidence that average returns will be different. But there is statistical evidence that volatility will be higher when the 200DMA is breached versus when it is not breached. I am not showing the math here but please do me on this. This is the key point to remember about moving averages: while I do not know why they work, they do help identify high volatility regimes.
Remember from this blog that volatility acts as a performance drag. Due to higher volatility, performance returns reduce despite statistically similar arithmetic returns. Breaching 200DMA is not a “trend/directional” indicator of up move or down but a risk on/risk off regime indicator as to the volatility increases. This should also tell you that you will get ripping up move and down moves. If any of these extreme moves manifest as they exit/enter the 200DMA, you will notice underperformance in the 200DMA strategy.
Low Volatility Regimes importance
If you are a retiree, the need for a low vol regime is self-evident. You cannot be happy to experience volatility on your portfolio when you are scheduled to do daily/monthly withdrawals and not add money into your nest egg. Remember that withdrawing money creates its volatility drag. Similarly, if you have planned your withdrawals around major events (say supporting kids’ education which typically have a fixed date), you do not want to be a buy-and-hold investor with possible daily volatility and hope for no further volatility.
Conclusion
Moving averages are indicators of a higher volatility regime. Higher volatility regimes in themselves reduce overall returns and hence moving average breaches can be used to tactically reduce our risk asset exposures.
In the next couple of blogs, I will explore strategies that are focused on volatility regimes and investing across other asset regimes. Stay tuned.